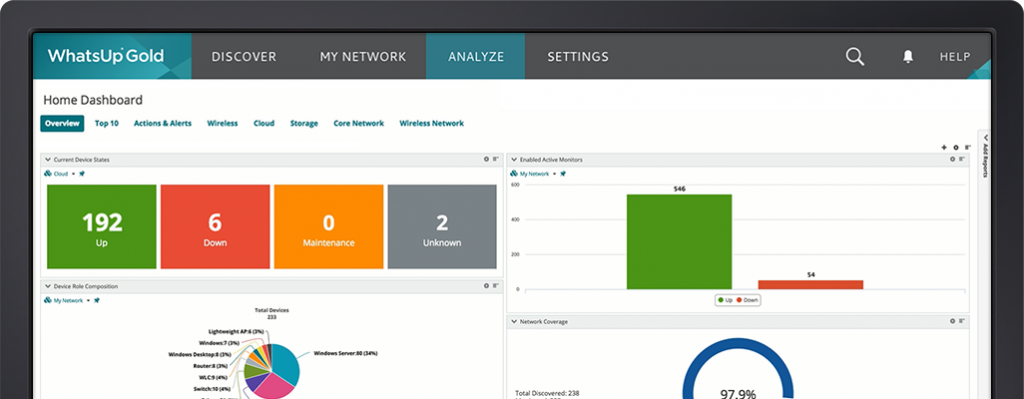
Up/Down Availability and Performance with WhatsUp Gold.
Avoid downtime with a network monitoring solution that covers you from the network edge to the cloud. See developing issues before users report them. Troubleshoot faster from an interactive topology map that shows connectivity and dependencies.
With WhatsUp Gold you get an at-a-glance up/down status and performance information for network devices, servers, storage and wireless – whether in the cloud or on-premises. Expand your management tool kit by adding proactive monitoring for network traffic, applications, virtual environments and device configurations – all through the same intuitive interface.
See what’s up and what’s down instantly. Get complete visibility to the status of network devices, systems and applications whether they are in the cloud or on-premises. Receive proactive notifications through SMS, email, web or Slack so you know about developing issues before users report them.
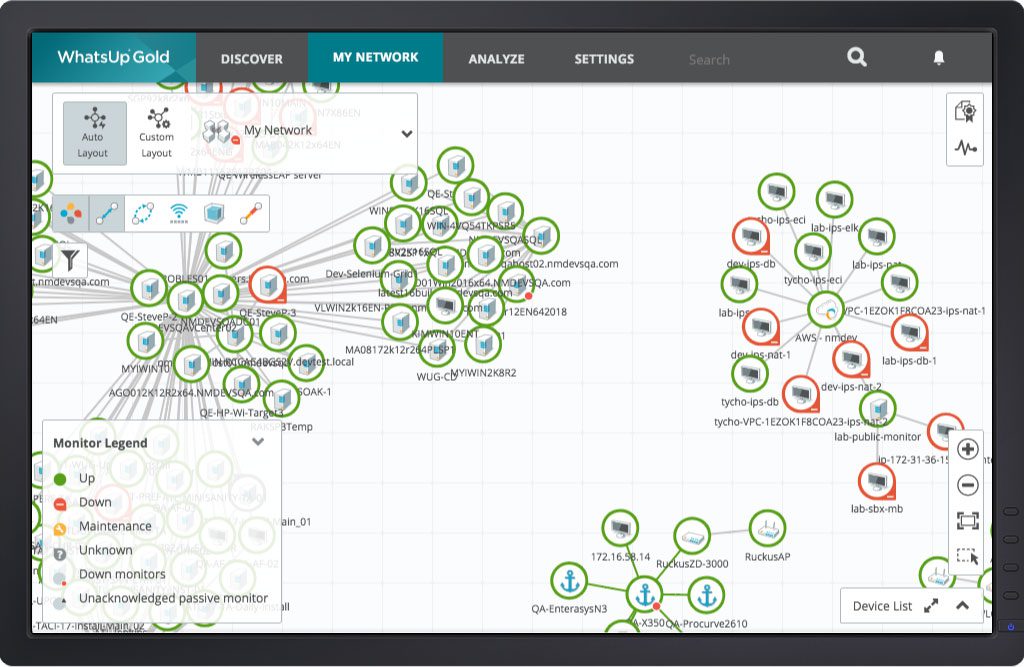
Automatically Discover and Map Your Entire Network
See connectivity and dependencies
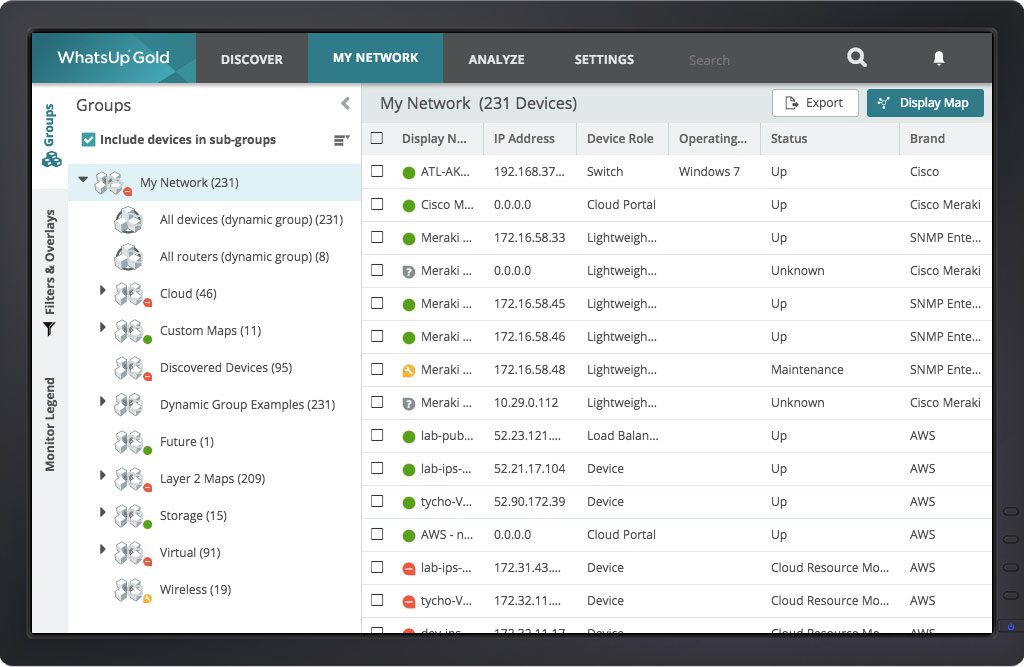
See network devices, servers, virtual, cloud and wireless environments in context. Click on any device to get immediate access to a wealth of related network monitoring settings and reports. See how everything is connected and get answers faster. WhatsUp® Gold creates a detailed interactive map of your entire networked infrastructure.
“You almost need a new word for this map – the dynamic zooming is fantastic! ”
Rob Smura, Klein Steel
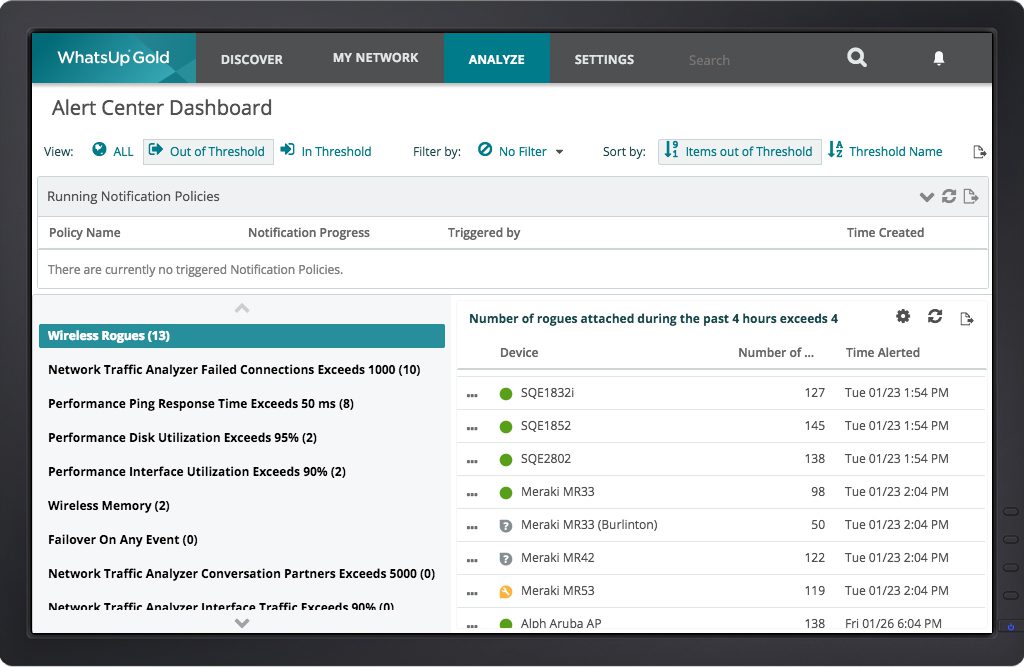
Monitor Network Health with Customizable Alerts
Know about problems before users call
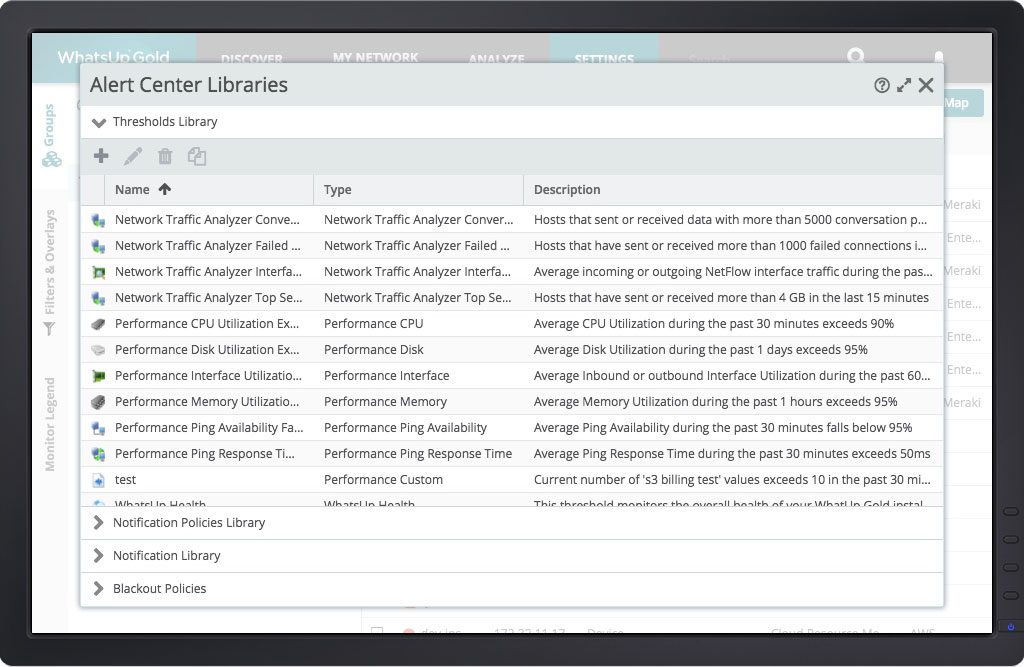
Use out-of-the-box thresholds set for common devices to generate alerts or adjust them for your needs. Define automated action policies to define what happens when a state change occurs including email alerts, SMS alerts, Slack alerts, service restarts, and web alarms. WhatsUp Gold’s alert center and dashboards put you in control.
“Wow! I can see right away what’s down. Getting device information is fast. ”
Mitchel Weinberger, GeoEngineers
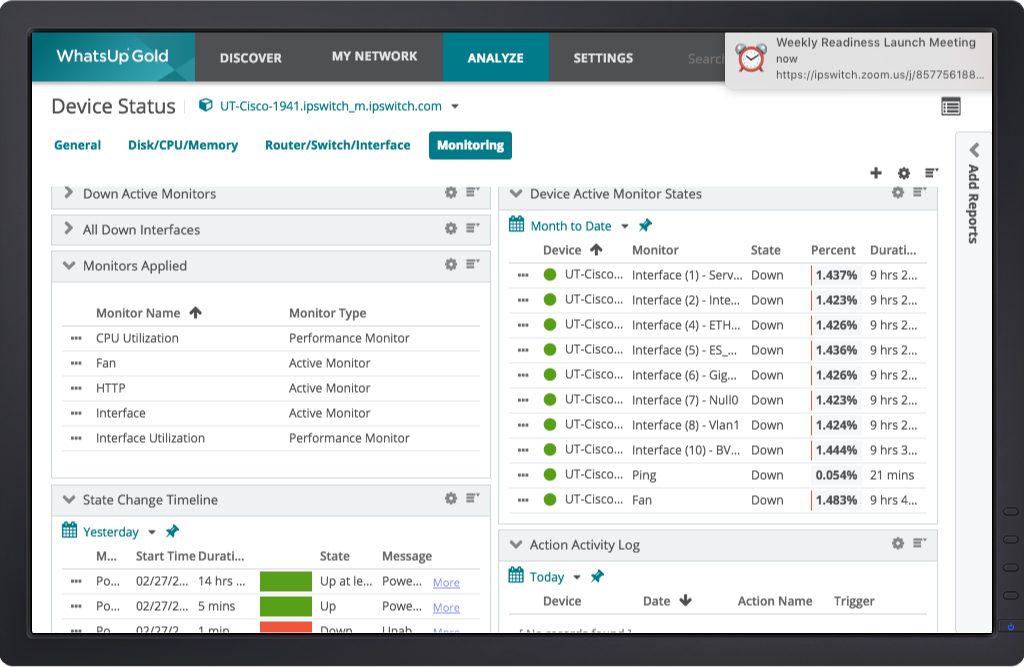
Drill-Down from Customized Dashboards
Get answers quickly and take action
Create dashboards for individual users or technology domains to provide the information you need to streamline troubleshooting or administration. Customize dashboards with reports for servers, applications, virtual, wireless, cloud and network traffic. Export or schedule report runs to share with your team or management.
“It’s our go-to product when we have network issues.”
Jeffrey Randall, US Treasury Department
Network Status in Your Pocket
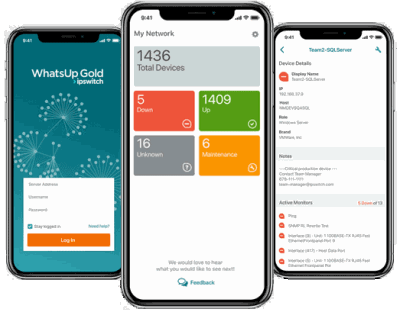
Now you can get current network information on your mobile device. See network status at a glance on the home page: what’s up, what’s down and what’s in maintenance mode. Browse for specific devices for details and put them into or out of maintenance mode no matter where you are. Put the power of WhatsUp Gold in your pocket today and start resolving issues from anywhere. Available now for iOS and Android.
Capabilities
Discovery & Network Mapping
WhatsUp Gold network monitoring begins with powerful Layer 2/3 discovery of devices and any networked server. Discovery and Mapping tools include:
- Scope of discovery determined by individual IP addresses, seed scan, IP address ranges, or subnets
- Easy to add credentials including SNMP, Windows domain administrator, ADO, Telnet/SSH, VMware, JMX and SMIS
- Scheduling for ad hoc or recurring discoveries
- Built-in, customizable device roles assign monitors based on device type
Network Monitoring & Alerting
Keep ahead of network performance and availability issues with powerful Active, Passive and Performance monitors and alerting features including:
- Active Monitors which poll devices for an up/down or yes/no response
- Passive monitors which include support for SNMP traps, Syslog, and Windows Event Logs from networked devices and servers
- Performance monitors using protocols such as SNMP, SSH or WMI to track utilization data of CPU, disk, memory etc.
- Get alerts via email, SMS, and web or alert the whole team via Slack.
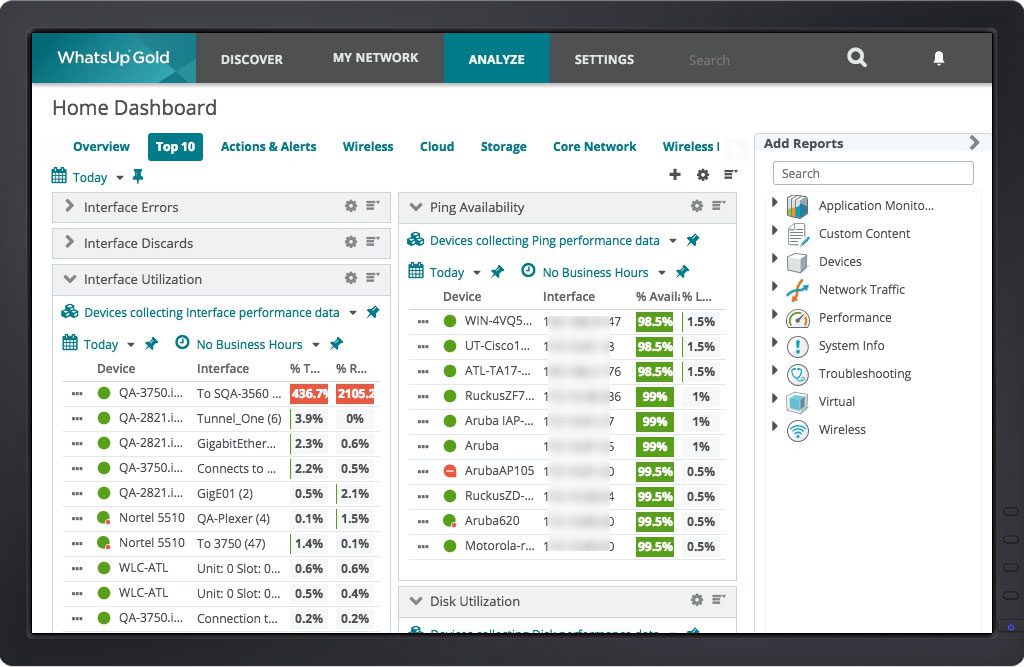
Reporting and Dashboards
WhatsUp Gold’s reporting interface makes it easy to quickly collect, refine and deliver the information your IT team needs. Dashboard and reporting features include:
- Sorting, addition or removal of columns with a single click
- Timeframe or business hour filters (depending on report context)
- ‘Pins’ that apply filter choices to multiple reports
- An Overview Dashboard that displays up/down status with red-green bar charts
- Flexible scheduling and email distribution
- Report exports in multiple formats
Cloud Monitoring
Our Cloud Monitoring dashboards allow you to track cloud resource usage and billing and provide cost-justification to management. WhatsUp Gold automatically discovers, maps and monitors cloud environments including Amazon Web Services and Azure servers. Report and alert on the performance of every metric your cloud service provides through its API. As with all WhatsUp Gold data, this can be stored for years in order to track long-term trends – something impossible with the 60 or 90-day metrics most cloud providers support.

Plug-In Modules
Each plug-in module integrates seamlessly with WhatsUp Gold extending core discovery, alerting, reporting and dashboard capabilities.

Network Traffic Analysis
With the addition of Network Traffic Analysis, your network devices can send flow records to port 9999 on the WhatsUp Gold server. We support a wide variety of flow protocols including NetFlow, NSEL, sFlow, J-Flow and IPFIX and includes features like:
- A centralized view of network traffic data with built-in reports
- Top application reports using Cisco’s NBAR classification data
- CBQoS reports for the details on class-based policies

Application Monitoring
Powerful application monitoring tools include the ability to record web transactions data to generate scripts and monitor the response times of web-applications. Quickly isolate the root causes of performance problems with features that include:
- Built-in, customizable monitoring profiles for Microsoft Exchange, SQL, SharePoint, and Active Directory
- Dashboard and reporting tools let you view the health of all the applications, individual application or troubleshoot at the component level.

Configuration Management
Support compliance requirements for HIPAA, SOX, FISMA and PCI DSS and other regulations. The Configuration Manager gives you a set of tools that will automate the process of backing up configurations for network devices that support Telnet or SSH. Other features include:
- Alerts for configuration changes (authorized or not)
- Audits that compare running configurations against defined policies
- Built-in scripts for SNMP string changes, user name adds/removals, configuration backups
Virtual Environment Monitoring
Virtual Monitoring gathers performance statistics for the host server and guest, maps out the virtual environment, and allows users to be notified based on information in event logs coming from the Hyper-V/VMware management server.
You can also discover management services (such as VMware vCenters) or individual hypervisors (Hyper-V, ESX/ESXi) running in an unmanaged environment. Using management services to discover virtual machines provides monitoring and logging continuity required in high-availability, fault tolerant or workload managed environments.
Failover Manager
Assure minimal monitoring downtime. Automatically switch WhatsUp Gold from a primary server to a standby server when the primary system is not functioning normally. The Failover Console displays primary server and secondary server data including:
- The machine’s host server address
- Machine status states including: Active – currently polling the network, Standby – ready to assume network polling, Down – unable to perform network polling, or Unknown
Distributed Monitoring
Gain more visibility to remote networks. The distributed network monitoring feature extends the capabilities of WhatsUp Gold to multiple remote networks, allowing a central installation server and one or more remote installations.
Monitor remote installations from a designated central server. Leverage distributed reports to create remote site dashboard views. A number of remote installations can send data back to the central server creating a unified view for managing multiple remote networks.
Easily Deploy in Your Environment
WhatsUp Gold works with major platform providers
Progress | Ipswitch tests and validates WhatsUp Gold with all of the leading technology platforms so you can be sure your deployment will be smooth. We stay platform-agnostic and provide in-depth reports across diverse environments.
